AUTHOR
Rosny Jean
School of Environment-Sustainability Institute, Florida Agricultural and Mechanical University, Tallahassee, FL 32307
THE ISSUE
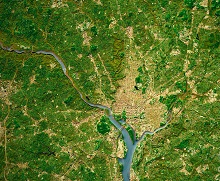
Urban trees and urban forests provide a variety of different benefits for a city including decreased energy expenditure, removal of pollutants, and increased property values. Mapping the spatial distribution of the urban trees in a city holds a significant value for maintenance and also for future planning regarding the need of additional trees and green spaces. However, the unequal distribution of urban trees poses environmental justice challenges. Identifying regions with limited tree cover is particularly important due to their vulnerability to the urban heat island effect. Such areas experience elevated temperatures, impacting residents' health and well-being. Recognizing these disparities becomes a pivotal step for city councils to prioritize interventions effectively, ensuring that environmental benefits are equitably distributed across communities. This figure set will provide students with visual insights into the distribution patterns of urban trees, enabling students to interpret and understand geographical variations.
FOUR DIMENSIONAL ECOLOGY EDUCATION (4DEE) FRAMEWORK
- Core Ecological Concepts:
- Ecosystems
- Ecology Practices:
- Quantitative reasoning and computational thinking
- Data analysis and interpretation
- Working collaboratively
- Human-Environment Interactions:
- Ethics
- Environmental ethics
- How humans shape and manage resources/ecosystems/the environment
- Urban ecosystems, urban ecology, urban-rural gradient
- Cross-cutting Themes:
- Spatial & Temporal
STUDENT-ACTIVE APPROACHES
Think-pair-share, hands-on image analysis, drawing predicted results, designing experiments, and understanding various software tools commonly used for object-based classification and image analysis (e.g., ArcGIS, QGIS, ENVI).
STUDENT ASSESSMENTS
Answering questions on a worksheet, sharing responses with the class, image interpretation, classification interpretation, and completing post-class homework that assesses understanding of key concepts.
CLASS TIME
This Figure Set is designed to span one 75-minute class or split over two 50-minute class sessions.
COURSE CONTEXT
This Figure Set is recommended as a part of advanced science courses, such as environmental science, geography, or remote sensing at undergraduate and graduate levels.
DOWNLOADS
ACKNOWLEDGMENTS
This Figure Set was developed as a part of the Teaching with Figures in Ecology Faculty Mentoring Network, which was supported by ESA's Transforming Ecology Education to 4D (TEE) Project with funding from the National Science Foundation (DBI-2120678).
CITATION
Rosny Jean. December 2023. Using RGB high-resolution color imagery for object-based image classification and assessing urban canopy cover. Teaching Issues and Experiments in Ecology, Vol. 19: Practice #14. https://tiee.esa.org/vol/v19/issues/figure_sets/jean_2/abstract.html