VOLUME 1: Table of Contents
TEACHING ISSUES AND EXPERIMENTS IN ECOLOGY
TEACHING
ALL VOLUMES
SUBMIT WORK
SEARCH

Figure Set 2: What is the evidence for N saturation of temperate forests?
Purpose: Help students understand the phenomenon called nitrogen saturation.
Teaching Approach: "support a statement"
Cognitive Skills: (see
Bloom's Taxonomy) — comprehension, interpretation, evaluation
Student Assessment: justification essay
FIGURE SET 2
-
Figure 2A. Stimulation of root growth from nitrogen and phosphate addition on roots growing into soil cores on east and
south-facing slopes in a West Virginia forest. Bars are 1 standard error. Dotted line indicates no stimulation by fertilization. W.
T. Peterjohn, C. J. Foster, M. J. Christ, and M. B. Adams. 1999. Patterns of nitrogen availability within a forested watershed
exhibiting symptoms of nitrogen saturation. Forest Ecology and Management 119: 247-257.
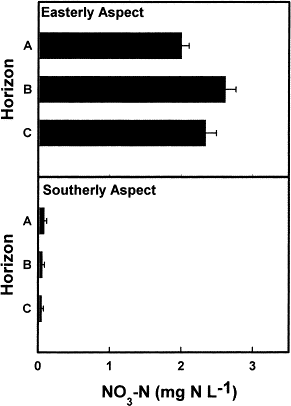
Figure 2B. Average concentrations of nitrate in water leaching down into the soil on east and south-facing slopes in a West Virginia forest. Bars represent 1 standard error of the mean. W. T. Peterjohn, C. J. Foster, M. J. Christ, and M. B. Adams. 1999. Patterns of nitrogen availability within a forested watershed exhibiting symptoms of nitrogen saturation. Forest Ecology and Management 119: 247-257.
For help, see the essay "Helping Your Students to Interpret Figures and Tables."

Figure 2A. Stimulation of root growth from nitrogen and phosphate addition on roots growing into soil cores on east and south-facing slopes in a West Virginia forest. Bars are 1 standard error. Dotted line indicates no stimulation by fertilization. W. T. Peterjohn, C. J. Foster, M. J. Christ, and M. B. Adams. 1999. Patterns of nitrogen availability within a forested watershed exhibiting symptoms of nitrogen saturation. Forest Ecology and Management 119: 247-257.
<top>
______________________________________________________________

Figure 2B. Average concentrations of nitrate in water leaching down into the soil on east and south-facing slopes in a West Virginia forest. Bars represent 1 standard error of the mean. W. T. Peterjohn, C. J. Foster, M. J. Christ, and M. B. Adams. 1999. Patterns of nitrogen availability within a forested watershed exhibiting symptoms of nitrogen saturation. Forest Ecology and Management 119: 247-257.
<top>